
Documentation
Visualize & diagrams
Build ER diagrams, chart results, track metrics, and read query plans visually.
Sometimes the fastest way to understand a database is to see it. TableR turns tables into ER diagrams, result sets into charts, and query plans into a readable graph — so you can explain a schema, spot a slow step, or hand a picture to the next person in the conversation.
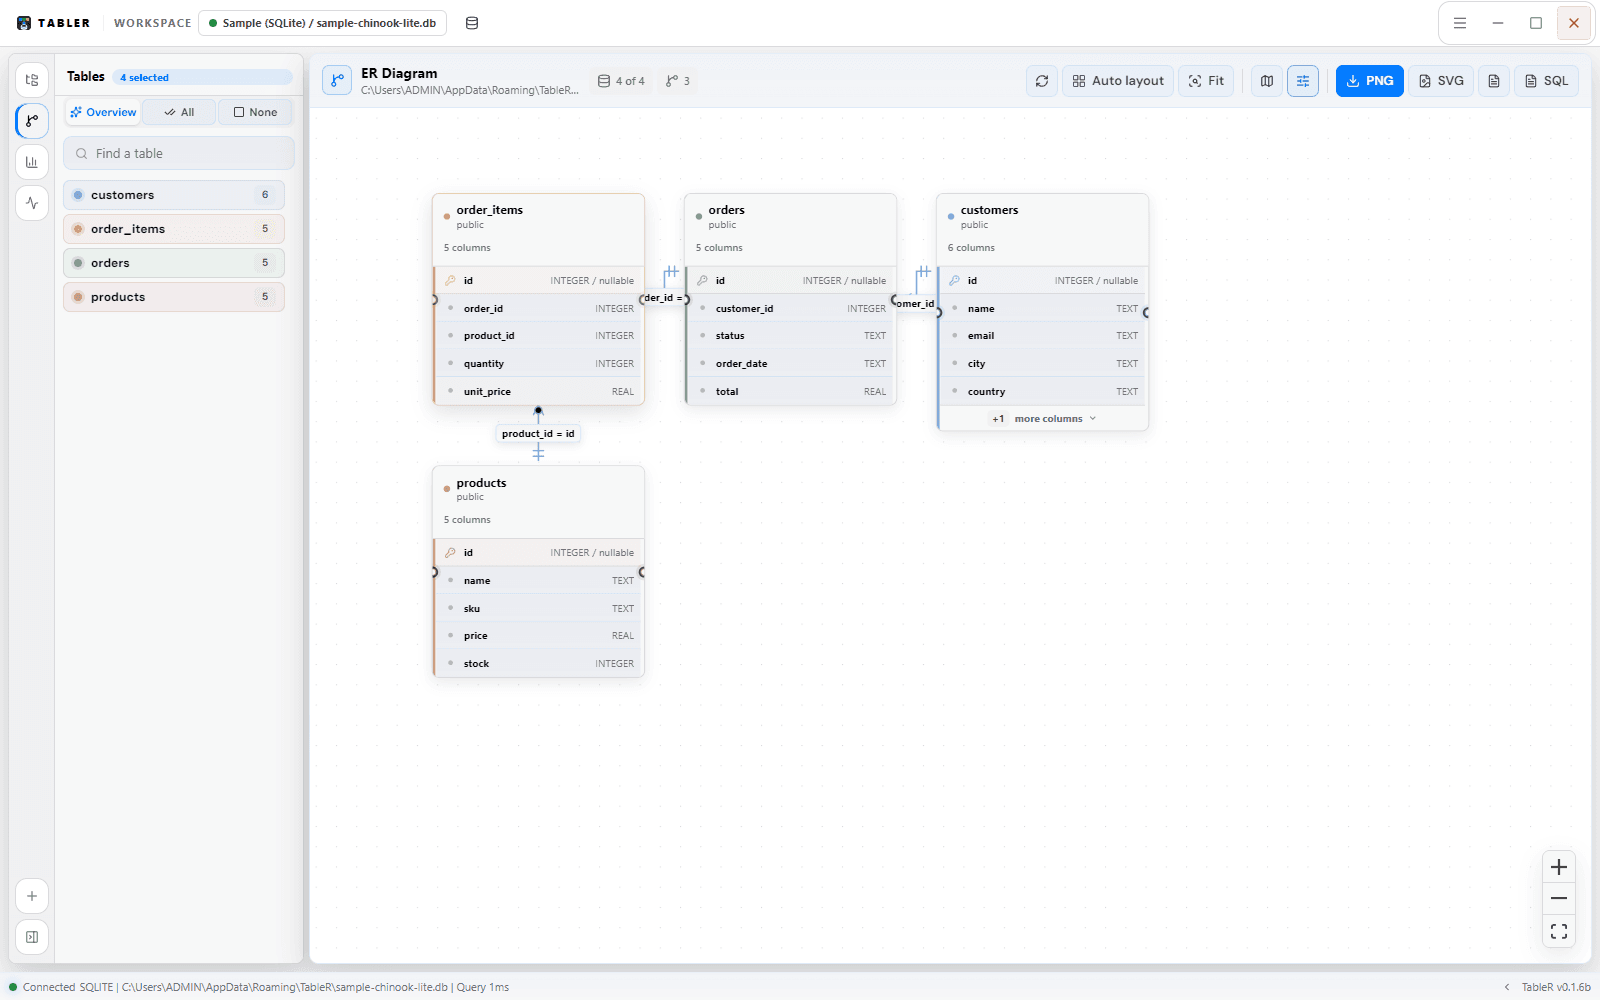
ER diagrams
Build an entity-relationship diagram from the tables you select. TableR reads foreign keys to draw the relationships, then lays the graph out for you.
- 1Select tables
Choose the tables that matter to the model you are describing — a feature area, not the whole database.
- 2Auto-layout
Let TableR arrange the graph, then fit the canvas to frame it.
- 3Inspect
Follow the lines between tables to trace foreign keys and cardinality.
- 4Export
Save the diagram as PNG to share, or export SQL for the modeled tables.
Navigate large schemas
- A minimap keeps you oriented when the graph is bigger than the screen.
- Zoom, pan, and fit-to-canvas controls move you around quickly.
- Drag tables to refine the auto-layout when you want a specific arrangement.
Charts
Any result set can become a chart without a round trip to the database. Run a query, switch the result to the chart view, and pick how to plot it — useful for a quick trend or a figure to drop into a report.
- Chart any result set with the built-in chart view (powered by Recharts).
- Choose the columns that map to the axes and series.
- Flip between table and chart on the same result at any time.
Metrics boards
Pin the numbers you check often — row counts, totals, health figures — to a metrics board so they stay visible while you work, instead of re-running the same query by hand.
Query plan visualization
Explain a statement to see how the engine intends to run it, rendered as a graph rather than raw text. Follow the steps to find the expensive scan or join, then adjust the query or add an index.
Plan detail depends on the database driver, so the richness of the visualization differs between engines.